Financial Markets Are Surprisingly Strong During The 3rd Quarter of 2020
Graves Light Lenhart Q3’20 Client Newsletter
Main Points:
*Financial markets were surprisingly strong during the quarter ended June 30, 2020. Nevertheless, we believe that investors should not become complacent. A detailed examination of the drivers of market returns over the quarter highlights the massive impact a small number of stocks are imparting on the popular indexes.
* The relative performance of growth versus value stocks is now more stretched than the dot.com bubble. The valuation chasm is wider as well. Value stocks have historically performed well coming out of recessions and regained the performance mantle. We do not know when this reversion will occur, but the change will likely be dramatic. As a reference, growth stocks lost their entire ten-year outperformance advantage over value within six months after the dot.com bubble burst.
*Investors should remember that stock prices are a function of a series of earnings stretching over many years. As such, a serious shortfall over a year or so may not materially impact the fair value of a stock if earnings are believed to rebound within a reasonable time frame.
* We encourage clients to review their goals and re-explore their unique views on their tolerance of future risk. Now is the time to update and refine financial plans. We look forward to working with clients–either in-person, when appropriate, or via electronic means–to improve their ability to live their best lives and realize their dreams.
“True wisdom comes to each of us when we realize how little we understand about life, ourselves, and the world around us.”
–Socrates
Overview
The quarter ended June 30th was as wild as the previous quarter. Surprising everyone, the stock market recouped much of the decline from the March quarter. Massive amounts of governmental financial support (both domestically and abroad), promising progress on a vaccine for COVID-19, and better than feared casualty numbers, have so far helped launch the massive rally in equity prices. The S&P 500 jumped 20.5% during the quarter bringing the year-to-date loss for the benchmark to -3.08% through June 30th. Domestic small-cap stocks experienced a strong rebound during Q2’2020 from their drubbing during Q1’2020 with the benchmark Russell 2000 index up 25.4% and International stocks rising approximately 16%. Fixed income and commodities enjoyed solid quarters as well, with the Bloomberg Barclays U.S. Aggregate Bond Index up 2.9% and the Bloomberg Commodity index up 5.08%. The strong financial asset returns over the past quarter brought many portfolios close to even for the year, implying that conditions are normalizing. Yet, a granular look at stock market behavior shows many crosscurrents and the outsized impact of a handful of stocks.
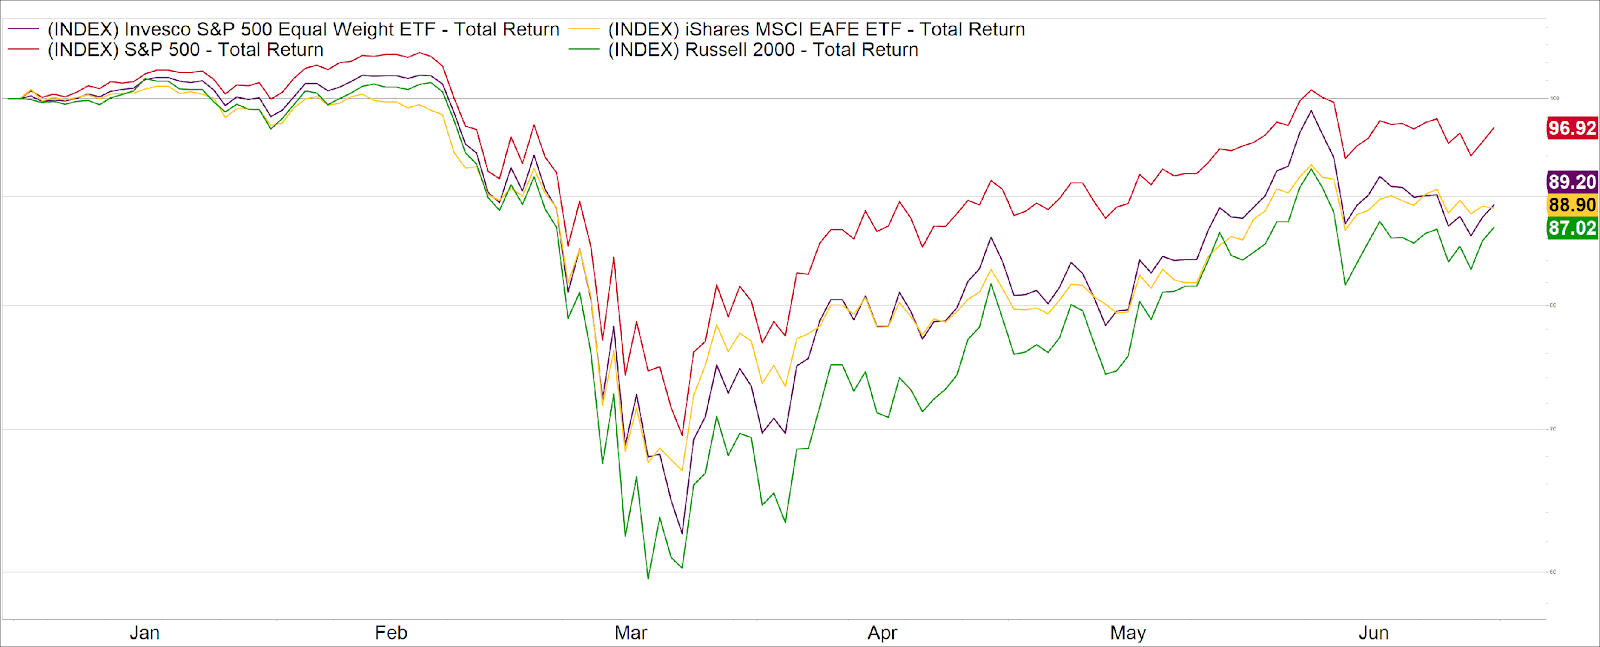
Source: FactSet
The preceding chart shows the indexed total return performance of popular domestic and international stocks indices for the first half of 2020. The S&P 500 came close to recapturing the year-to-date loses by June 30th. However, the S&P 500’s performance has been heavily influenced by the handful of technology stocks with huge weightings within the S&P 500. At the end of June, five stocks accounted for 21.5% of the market capitalization of the entire S&P 500 – Amazon, Apple, Facebook, Alphabet (aka Google), and Microsoft. This was the highest concentration of the largest five stocks since 1974 during the heyday of the “Nifty Fifty” equity bubble. For reference, the chart above also includes the S&P 500 Equally Weighted index, in which all 500 stocks have the same weighting. This index performed similarly to both small-cap domestic stocks and international stocks and demonstrates the impact of a few highly valued technology stocks.
The State of the Market, and Looking Forward
Throughout the quarter, investors expressed frequent surprise at the apparent buoyancy of the market. Indeed, the 20.5% second quarter return to the S&P 500 was the largest quarterly gain since 1998. How is it possible that the country is engulfed in a worldwide pandemic that has cost more than 130,000 American lives, that the unemployment rate has spiked from 3.5% in February to 11.1% in June, that virus prevalence in much of the country continues to grow while in many of our strategic competitors it appears to recede, and yet the U.S. stock market is only down -3.1% for the year through June 30th?
As always, it is important to remember what the stock market is, and what it is not. The stock market is not a barometer for how well the county is doing broadly. It is not a gauge of the well-being of U.S. citizens. The stock market is a gauge of the value, according to investors, of the publicly traded companies listed in the United States. Many factors go into the determination of this value, some of which include irrationality, changing degrees of risk aversion, and behavioral biases.
Economic statistics, such as GDP and employment levels, have much less market impact than commonly believed. Furthermore, investment related decisions based on such numbers are fraught with difficult questions, such as how much improvement in the statistic in question is needed before a purchase will be made? Given that the stock market discounts the future, stock prices often appreciate before the official statistical determination has been released. The trick, which is devilishly difficult to do, is to judge when the consensus estimate is too optimistic or pessimistic. The deviation from consensus, or the collective expectation of the market, is a key driver of short-term security prices. The link below references a Morningstar article which expands on these concepts.
https://www.morningstar.com/articles/982525/the-stock-market-is-not-the-economy
A better long-run explanation for returns tends to be the “discounted cash flow” model, or DCF. This model is based on rational evaluation of the expected future payments of the firm over many years. DCF has useful things to say about our present market condition. DCF posits that we should take the sum of all the future payments made by a stock, and with some adjustments (future values are weighted less heavily than current values), that should be value of the stock price. Let’s consider a very (almost comically) simple example. Consider a company that is expected to profit by $10 each year for 10 years, and let that company represent the entire market. Ignoring the discounting “adjustment,” that would imply a stock price of $100. Now, imagine a catastrophe in the economy, such that the company is expected to earn zero for a year. In years two through ten, the company is still expected to earn $10 per year, and so the stock price would be expected to be $90. The rational stock market responds by declining 10%.
The key takeaway from the simple example is that earnings can be devastated in the short run, while not necessarily having devastating consequences for asset prices, so long as earnings are expected to rebound quickly. Much of the gyration in the market over the past months have been traders in the market grappling with the intermediate-term uncertainty of the economic impact of the coronavirus. Uncertainty gives rise to volatility, but not necessarily to cataclysm (or euphoria, for that matter).
Our recommendation continues to be humility. Humility that we do not know the course of the virus, and therefore of the economy. It may well be that the recent flare-ups result in depressed economic activity (whether government-induced or freely by individual choice) and lower company profits, and therefore lower stock prices. Alternatively, better treatments and possibly vaccines may arrive rapidly enough to limit further economic damage, which would clearly be profit-enhancing and therefore share price enhancing. Investment history suggests that consistent exposure to the market tempered by individual risk tolerance is an effective way to survive and thrive in uncertain economic environments, rather than flailing attempts at market timing.
While these free market gyrations are to be expected as investors process the high degree of uncertainty in the world today, there is a significant force acting on markets that is decidedly not a free market mechanism. Central banks around the globe have been intervening to support asset markets, with the U.S. Federal Reserve at the forefront. The Federal Reserve has committed to buying at least $700 billion worth of long-term government bonds and other long-term securities, while simultaneously lowering the Federal Funds rate to zero. According to Evercore ISI, in the past year 505 stimulus initiatives (both fiscal and monetary) have been suggested worldwide, also including close to $3 trillion in U.S. support via fiscal policy. The sum of these initiatives, enacted from Jordan to Malaysia, from Argentina to Serbia, is that the world is awash in liquidity.
In the context of our simple DCF model above, the interventions have two effects. Most crucially, the policy aim is to shorten the time of the recession, with the hope of allowing firms to return to earning profits as soon as possible. Naturally, it is uncertain at this point whether the interventions will be successful in achieving this goal. However, the real economy has proved more resilient than the early coronavirus-era forecasts suggested. Second, the lower interest rates affect the discounting “adjustment” we alluded to above, also increasing asset prices.
The real economy has presented us with some frightening numbers these past few months. For example, the unemployment rate in June fell to 11.1% from an April high of 14.7%. Both rates are higher than at any time since the Great Depression, and so the recent improvement doesn’t initially appear to be cause for celebration. However, both numbers were lower than the expected rate of unemployment prior to their publication. This has notable stock market implications.
Think back again to our simple DCF model. If our hypothetical company is expected to earn $10 from years 2 through 10, part of what forms that expectation is the forecasted unemployment rate. Currently, that forecast is for very high unemployment. But indications that the unemployment rate is lower than expected (even if it is still very high by historical standards) is a positive for the market. If the forecasts prove overly pessimistic, people will have more money to buy goods and services from the company than expected, and so we’d revise the expectation of the company’s earnings (and therefore its stock price) upward. The important takeaway is that stock price movements will typically react to deviations in economic variables from their expected values. If you expect the unemployment rate to be 15%, and it turns out to be 11%, well, perhaps there is some celebrating to be had after all.
When the world has an “excess” of liquidity, that money must find a home. Most typically this home is in investment assets of varying degrees of risk. Globally, there is so much excess liquidity in the market right now that it is having an upward price pressure on everything from sovereign bonds to stock markets. While negative news can certainly cause asset prices to decline, this liquidity provides a strong buoyant force inflating asset prices above what they would otherwise be.
Classical monetary theory holds that Money Supply x Velocity=Price x Quantity, which is denoted by the equation MV=PQ. Typically, central banks try to influence the money supply with an eye on how quickly money moves through the economy (velocity) to maintain price levels. A decline in general prices is dangerous for heavily indebted countries as falling prices negatively affect incomes while debt service levels remain the same. Near-term, increased money supply which cannot be readily absorbed into economic activity can impact asset prices. The Federal Reserve measures the money supply in several ways. One broad measure is the M2 money supply, which includes such holdings as money market accounts and savings deposits.
The Marshallian K is measured as M2/Nominal GDP. It is the inverse of the velocity of money – so the larger this ratio, the slower money moves around the economy. If money moves around more slowly, it tends to settle into asset holdings. Therefore, this ratio captures the propensity for excess money to impact asset prices. Currently, the M2 money supply indicator is up approximately 25% year-over-year while U.S. GDP is suffering an economic decline worse than the Great Recession of 2008-2009. Both effects increase the Marshallian K ratio, providing one possible explanation to the surprisingly strong stock market advance since late March.
The negative forces of the current economic recession and the positive forces of government intervention of course combine to affect the current state of the market. They are conflicting by design – the entire purpose of the interventions is to support the economy, often through increased asset prices. This conflict gives rise to market volatility.
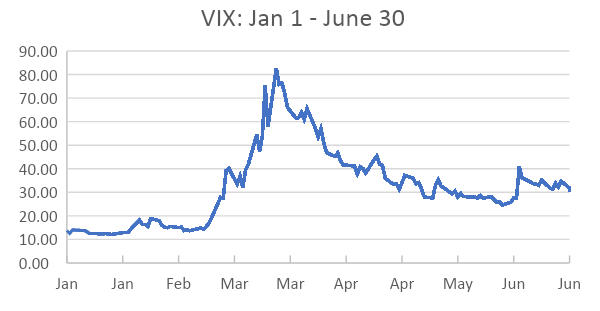
Volatility is not a quantity that can be directly observed in the market, we can only estimate it. One common method by which it is estimated is an index known as the VIX. The VIX is derived from S&P 500 option prices, and as such provides a forward-looking estimate of the volatility of that index. The VIX tends to be negatively correlated with market returns. Intuitively, markets favor stability, and so when uncertainty (volatility) is high, returns tend to be low. The figure demonstrates the evolution of the VIX index for the first two quarters of 2020. The surge of uncertainty can be seen in mid-March, coincident with the most severe attempts to contain the virus. Gradually, as understanding about the new state of the world and markets came to be better (though obviously, incompletely) understood, volatility declined. At the end of the quarter we find ourselves in a situation of heightened uncertainty, as the VIX is almost twice what it was at the beginning of the year. Nonetheless, volatility is well off its mid-March highs.
Where to invest?
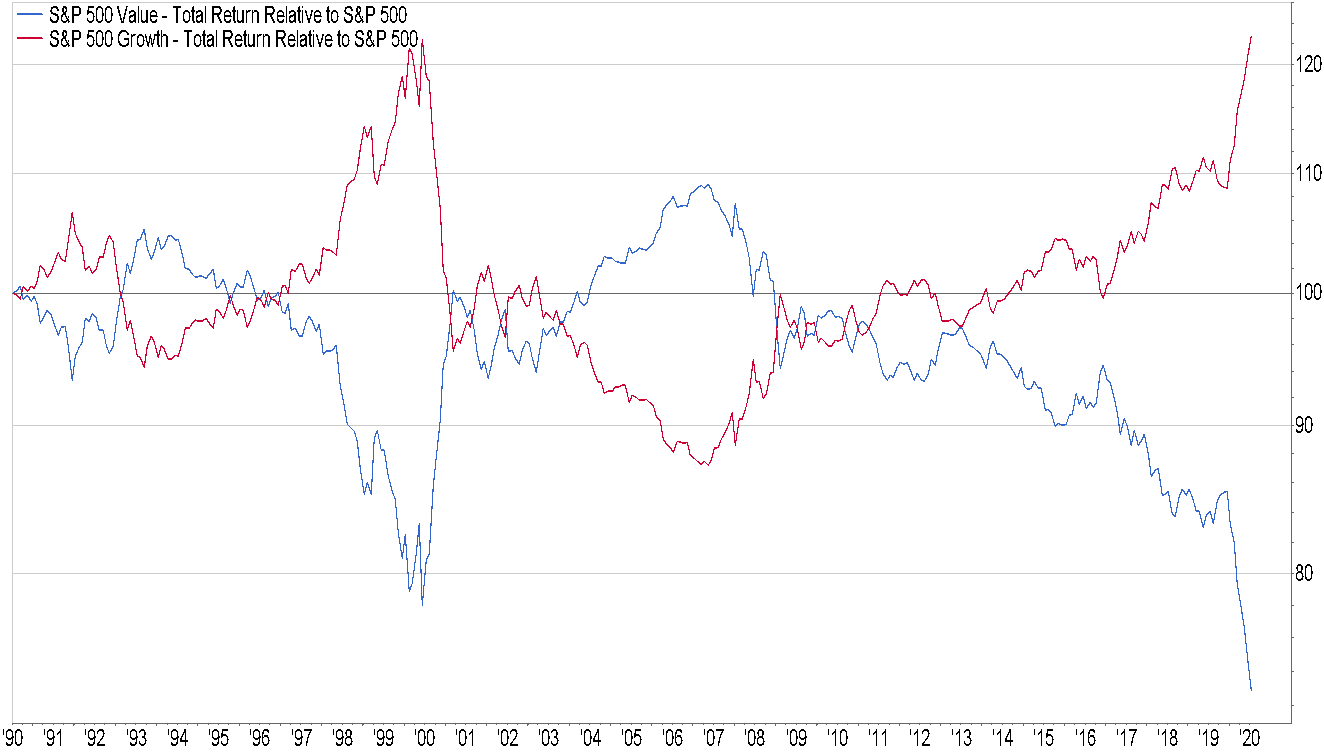
For some time, we’ve highlighted the disparity between the growth and value sides of the stock market. Growth stocks have enjoyed a stellar ten-year period of outperformance. Yet, growth stocks are more richly priced relative to value stocks than during the dot.com bubble, which is something we never thought we would see again in our lifetimes. We still believe value stocks offer superior return potential, despite the breathtaking performance from the growth stock side of the market.
Value stocks have performed poorly both in absolute and relative terms so far in 2020. In our last quarterly letter, we highlighted our research examining the performance of value versus growth stocks in times of significant market stress. We found that value tends to outperform growth after substantial market shocks, with the acknowledgement of a limited number of observations. Research Affiliates recently published a paper which found that value stocks strongly outperform during bear markets associated with the bursting of stock market bubbles–which was our concern coming into 2020–but perform no better than the overall stock market when bear markets result from a fundamental shock, such as the current environment. Historically, value has outperformed during the subsequent market recovery (2 years in this study) which lead to meaningful outperformance over the entire bear market and subsequent recovery cycle regardless of whether the bear market was caused by bubble conditions or fundamental shocks.
Source: FactSet
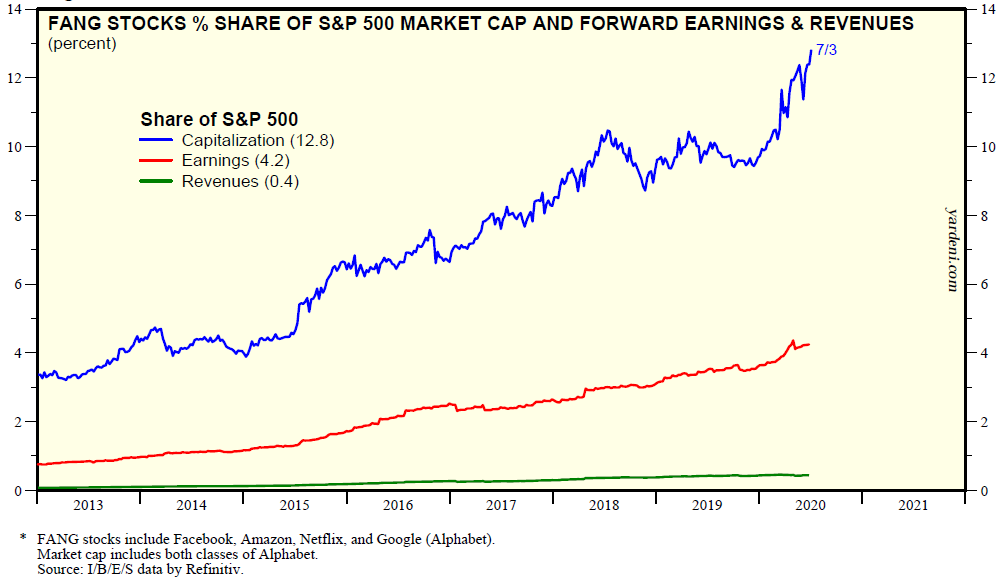
As shown in the above graph, the relative performance difference between growth and value has experienced a dramatic acceleration over the past few months. Historically, such dramatic moves have presaged meaningful performance reversals. The oft referenced FANG stock group–Facebook, Amazon, Netflix, and Google (Alphabet)–have been major drivers of the performance disparity. Yet, the relative market capitalization of such stocks remains well out of balance with their revenue and earnings contributions. As such, the expectations built into the valuations of these stocks are extremely optimistic. When the dot.com bubble broke in 2000, the growth side of the market lost all the relative performance gained over the previous ten years within six months. In our opinion, current conditions give rise to the possibility of a substantial reversal between growth and value.
Fixed income securities are difficult to love. Current yields are historically low, in large part due to governmental intervention. Inflation risks are low over the short-term but fixed income securities could experience poor future returns if inflation emerges, which we believe is a valid risk given the massive fiscal and monetary stimulus programs. Commodity exposure should help offset the risk of inflation and we continue to recommend adding exposure to the asset class.
Financial assets have rebounded strongly over the past few months, much to the surprise of everyone. Yet, we do not believe this is a time for complacency. We encourage clients to review their goals and re-explore their unique views on their tolerance of future risk. Now is the time to update and refine financial plans. We look forward to working with clients–either in-person, when appropriate, or via electronic means–to improve their ability to live their best lives and realize their dreams.
Best regards,
Asa W. Graves VII, CFA – Chief Investment Officer
Jason Fink, PhD – Director of Research