Client Newsletter
Third Quarter 2021
Main Points:
- In general, securities markets enjoyed strong results during the Q2’21 quarter (ended June 30, 2021). Yet, market conditions became more volatile during the last two weeks of June which appeared to signal a potential change in market and/or economic conditions. Treasury yields dropped precipitously while the overall equity market reached an all-time high.
- U.S. economic growth continues to be supported by massive monetary and fiscal stimulus. In addition, the global economy should react favorably to additional COVID vaccinations as economies continue to re-open in concert with significant pent-up demand. However, there are some concerns about how economies will behave as stimulus is removed.
- The U.S. 10-year Treasury Note yield continues to be a key financial indicator despite the attendant effects of intervention from the Federal Reserve. We believe that the 10 year’s yield should be meaningfully higher to reflect expected economic growth and inflation expectations. Nevertheless, a continued decline in the 10-year’s yield will likely prove deleterious to the relative performance of our asset positioning.
- Overall, we find equities to be more attractive long-term investments relative to bonds. Our view remains that domestic value-oriented and international stocks offer much better risk/return opportunities than large U.S. growth stocks.
- We continue to investigate how to best improve our clients’ odds of meeting their long-term goals given today’s realities. As such, we want to emphasize that our goal is to focus on what we can control, which is premised upon long-term financial planning issues such as risk management, realistic goals, and tax planning.
“The most difficult thing is the decision to act, the rest is merely tenacity.”—Amelia Earhart
While the economic narrative remained broadly constructive during Q2 2021 (June-end), there was a pricing pivot observed late-quarter despite stocks maintaining an upward, albeit erratic, ascent. Late in the quarter, market conditions changed and many asset classes experienced rapid price fluctuations which could be reflective of increased worries over future economic weakness. While the stimulus provided in the wake of the greatest health crisis in modern times was unprecedented, the looming unwind of this colossal support is equally lacking a blueprint which has caused bouts of volatility. We expect such volatility to continue for the foreseeable future.
Entering the quarter, the oft-cited reopening trade was a significant beneficiary of a resurgent US economy as previously idled industries began to reopen. To start the year, value stocks – shares considered to be meaningfully undervalued by some metric – had benefited from their sensitivity to the improving economy. In relative terms, the Russell 1000 Value Index reported a total return1 of +11.3% over the first three months of the year, outperforming the Russell 1000 Growth Index by over 10%(!). However, their lead began shrinking from mid May, as a subsequent drop in bond market interest rates signaled that while the economy is rapidly recovering, it may be rounding its “peak-growth” turn. To this extent, the accompanying decline in longer-dated US Treasury yields provided a lurch towards more expensive, growth-oriented equities. While the S&P 500 returned 8.6% during the June-end quarter, the Russell 1000 Growth Index achieved a 12.9% return, more than double that of the Russell 1000 Value Index.
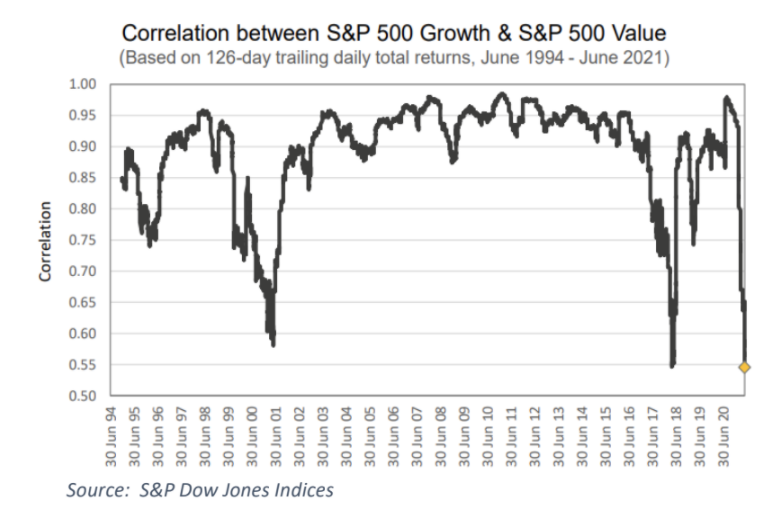
Correlation Between S&P 500 Growth and S&P 500 Value:
(Based on 126-day trailing daily total returns, June 1994-June 2021)
- Y-axis shows correlation
- X-axis shows dates
**Source: S&P Dow Jones Indices**
The relative behavior in these two investment styles continues to operate at anomalous levels, as the chart to the right from S&P Dow Jones shows. Since 1995, the trailing average 6-month correlation between the daily returns of the S&P 500 Growth and S&P Value indices has averaged around 89%. The latest data (capturing June’s performance), indicates a collapse in correlation between the two indices to 55%, their lowest-ever degree recorded over that time frame.
High quality fixed income instruments benefitted from the recent decline in interest rates (reminder: bond prices move inversely with rates). Following a poor first quarter performance, the Bloomberg Barclays US Aggregate (representing a consortium of bonds from government to corporate securities) achieved a total return of 1.8% during the second quarter but remained negative for the first half of the year as a whole. Notably, forward inflation expectations witnessed a cooling effect over the quarter. We highlight the 5-year breakeven inflation rate, which is a market derived measure of expected annualized inflation over the term period. Having peaked at over 2.7% in mid-May, this market-based indicator for future inflation quickly softened, ending the quarter at 2.5%. What is implied is that the bond market is more closely aligning its view with the Federal Reserve that recent inflationary spikes will indeed prove to be short-lived or otherwise suppressed through the Fed’s monetary toolkit if necessary.
In light of recent market behavior, we see that for a number of “known unknowns”, the markets are sending differing signals. For example, the economic ramifications of the spreading Delta variant (amongst many others) remain indeterminant, yet concerns are constantly surfacing. While the Treasury market is pricing in a degree of caution as rates decline, equities continue to pierce all-time highs. We would also highlight other significant credit markets, which carry equity-like risk attributes, that conversely appear untroubled by the steep, recent decline in Treasury rates.
The High Yield bond market, furnished with the “junk bond” moniker, is known to trade on a spread-basis relative to Treasury yields. Simplistically, the higher the spread versus underlying Treasury rates, the greater the implied risk of default and vice-versa. Historically, the High Yield market has provided an early indication for developing risks within its large base of corporate issuers. In the US, High Yield spreads (using Merrill indices), compressed during the 2nd quarter and remain at the lower end of both the recent 3-month trading range and historical levels. We are seeing a similar underlying trend for the High Yield market in Europe, where vaccination efforts remain in catch-up mode along with increasingly prevalent Delta cases.
In short, these important credit markets are not transmitting ominous signals or signs of stress, which would manifest in a widening spreads (i.e. higher yields relative to safer bonds) as investors would demand higher returns to offset the increased risk; since this is not happening the credit markets do not appear to be alarmed about future economic growth prospects. However, there are a myriad of technical factors in the form of continued central bank security purchases as well as sustained bond inflows from both foreign and domestic investors which appear to be having a suppressing effect on interest rates, but these effects are hard to measure.
Economic Trends Remain Solid Overall
The US economy has been roaring back at an unprecedented pace, with recent data suggesting that the sectors worst hit by the pandemic-induced shutdown are moving towards normalization. For the most recent nonfarm payroll release – a key indicator for the US labor market – most industries posted job gains in June, but the leader once again was leisure and hospitality with 343,000 in net new jobs, up for the fifth consecutive month. While not overly surprising given the leisure and hospitality industry was the most affected by the pandemic, its forceful response to COVID restrictions being lifted across the country is indicative of a labor market which is on the mend. Short-term labor shortages are often cited as a near-term restraint on a full-fledged employment recovery. It is possible that these issues will prove temporary as unemployment benefits are scaled back coupled with improvements in the labor participation rate as schools are expected to broadly reopen in the fall. Additionally, there is some research suggesting that the post-pandemic labor market may remain more favorable to labor rather than capital for an extended period (2).
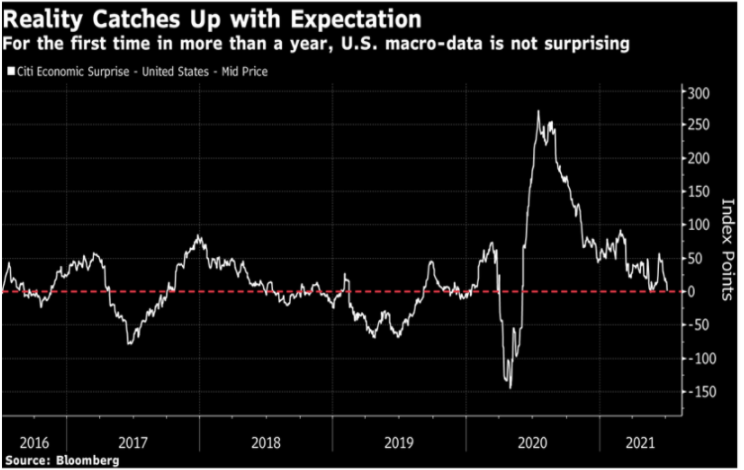
While Gross Domestic Product (GDP) trends are expected to remain positive with consensus broker estimates(3) for +6.5% growth in 2021 and +4.0% in 2022, the reality of these prospects is now settling in. The point here is that the strength of the US economy is no longer catching forecasters by surprise, as certain data points including the recent ISM release, have missed consensus expectations while also revealing that the economy is still growing. The Citi Economic Surprise Index, which measures the degree to which economic data is either beating or missing expectations, is at its lowest level since pre-pandemic (see exhibit). While expectations for growth remain robust, the perennial underestimation of the recovery appears to be behind us, which raises the question if all of the “good news” is now broadly reflected within many security prices.
Reality Catches Up with Expectation
For the 1st time in more than a year, U.S. macro data is not surprising
- Citi Economic Surprise- United States- Mid-Price
- Y-axis is Index Points
- X-axis is year
**Source: Bloomberg**
Domestic economic growth continues to be supported by the massive monetary and fiscal stimulus efforts of the U.S. Government. As COVID vaccines reach more people, the economy could experience historically strong growth through 2021 due to the confluence of stimulus and a further reopening of the economy, unleashing significant pent-up demand. However, there is some question about how the U.S. economy will behave during 2022 and beyond with the curtailment of government- led support.
International economic recoveries remain uneven with problematic vaccination trends. The science community has done their part with the development of quality options to provide robust resistance to the onset of severe COVID related ailments. Nonetheless, issues with the supply of and the demand for such vaccines has resulted in continued COVID related pressures, especially within many emerging economies.
After peaking near 1.80% earlier in the year, the 10-year Treasury Note yield has fallen to as low as 1.25%, with a significant percentage of the decline occurring over the last month or so. In addition, other asset classes, such as certain equities and commodities, have experienced coincidental trend changes that appear to signal concomitant worries over the future economic environment. We believe that economic growth will likely remain solid for the foreseeable future, absent a surprise economic shock. As such, we believe that the Fed’s QE program’s secular pressure on bond yields has been “turbocharged” due to the recent confluence of technical issues within the short-term segment of the fixed income market and heightened fears of resurgent COVID infections. As such, we believe the recent drop in the 10 year Treasury yield will reverse over the next few months, but we must point out that our investment posture will likely prove suboptimal if the yield continues to decline.
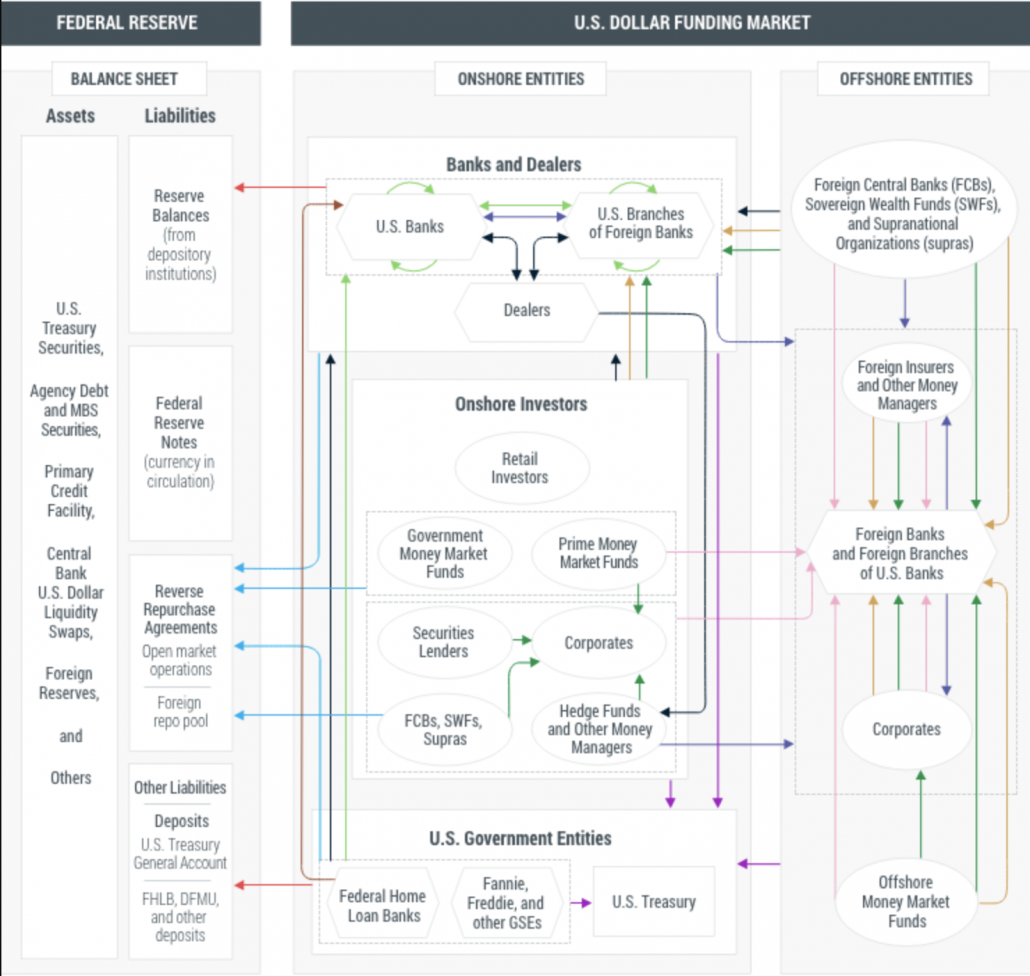
Diagram showing Federal Reserve & U.S. Dollar Funding Market
**Source: Credit Suisse**
In its effort to support the economy and to keep interest rates anchored at low levels, the Fed has evolved into the largest buyer of newly issued government debt. In our opinion, the relationship of the 10-year Treasury yield with the real economy has likely become distorted over the past decade or so, and this distortion has been further magnified over the last year and a half. The reason for this distortion is that since 2009, the Fed has enacted various programs to enact quantitative easing (QE). More recently, market watchers have increasingly focused on technical issues occurring within the short- end of the Treasury curve and money markets, as tremendous liquidity injections combined with recent tweaks in overnight lending rates have further influenced market dynamics. As shown in the chart to the right, the “plumbing” of the short-term credit markets is incredibly complex. As such, non- market derived price levels can lead to a chain reaction throughout the funding markets. We are closely watching reports of anomalous Source: Credit Suisse behavior within such markets, but we have not been able to synthesize a thesis of likely impacts to the broader financial markets. Furthermore, various sources have reported that the Fed has been buying more Treasury securities than have been issued over the past few months, which has likely led to pressure on rates due to the simple supply vs. demand dynamic. The take-away is that a myriad of forces, some complementary and some antagonistic, are currently at play obfuscating the message of the fixed income market.
The 10-year Treasury yield has long been a widely followed market and economic barometer as well as an important driver of equity returns. Historically, shorter-dated yields are less influenced by the free market economy as the Federal Reserve tends to manage interest rate policy via shorter-term instruments. Therefore, the behavior of the relatively market-driven, long-dated 10-year Treasury has historically been more reflective of economic fundamentals than shorter duration Treasury instruments.
One of the most impactful tools the Fed has used, besides the direct purchase of Treasury securities, has been the buying and selling of mortgage-backed securities (MBS) to influence longer-term interest rates in addition to the shorter ones they typically manipulate. Since MBS have many characteristics similar to the 10-year Treasury note, Fed buying and selling of MBS has a potentially strong effect on the 10-year Treasury yield. There is currently a significant debate concerning the “true” level of inflation and the degree to which the current inflation in the system is transitory. As of July 2, Evercore ISI, a respected economic forecasting service, estimates inflation in the region of 4% for the entirety of 2021, and 3% for 2022(4). The 10-year Treasury rate, left to market forces alone, would be expected to be something above these levels, leaving a positive “real” (inflation-adjusted) return. In fact, the long-term real rate (i.e. excluding inflation) has averaged approximately 2.25% over many decades with the inflation rate added to establish the nominal yield, which is the fancy definition of the quoted market-based rate.
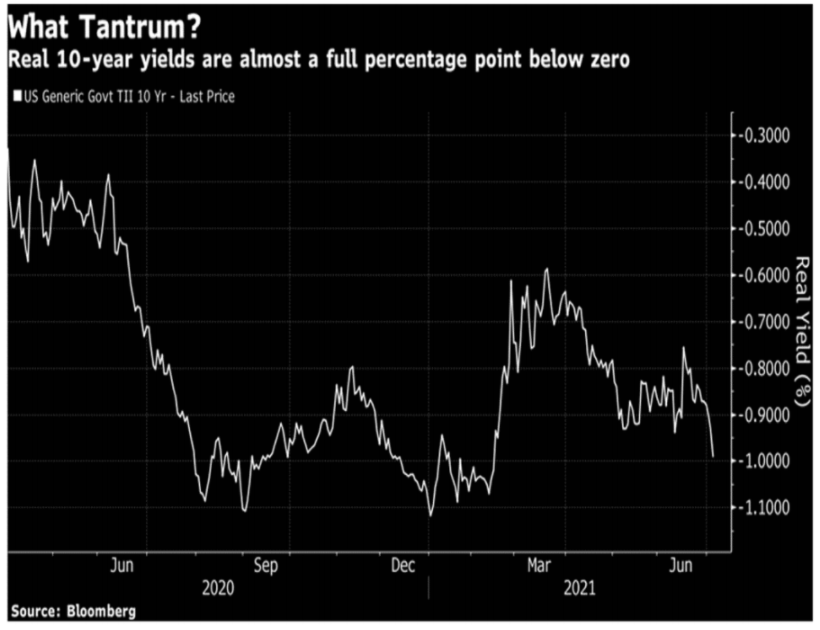
What Tantrum?
Real 10-year yields are almost a full percentage point below zero
- Y-axis: Real Yield
- X-axis: Month & Year
**Source: Bloomberg**
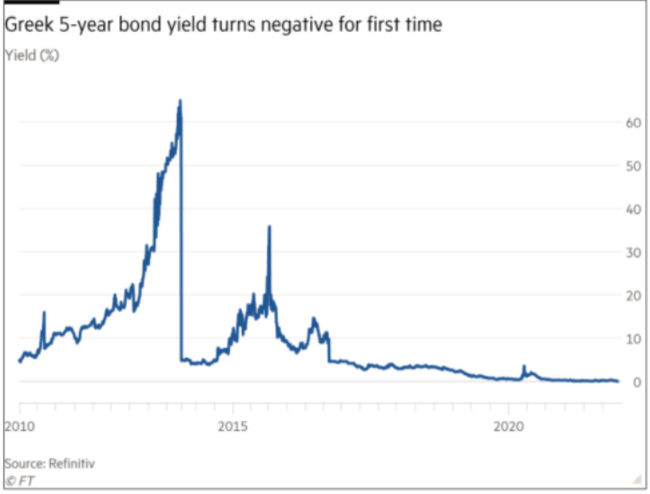
That the 10- year Treasury yield is currently around 1.35%, with longer-term inflation expectations above 2% and current year-over-year inflation measures above 4%, indicates the magnitude of the distortion between this market rate and the real economy. Such seemingly non-sensical distortions are present around the globe. For instance, Greek five-year bonds are now trading at negative yields, which means that investors are effectively paying the Greek government to borrow money from them. Talk about market amnesia!
Nominal yields on Greek bonds went negative for first time… leaving only Italy with positive yielding bonds in Europe.
- Y-axis: Yield Percentage
- X-axis: Year
**Source: Refinitiv**
The 10-year Treasury yield continues to be a key financial market indicator, despite our concerns and rationalizations. While the effects of Fed interventions are distortionary (by design), the economic forecasts of other market participants will continue to have effects on the 10-year Treasury rate as well as on other market variables, but these effects will be deviations from a baseline established by the Fed’s behavior. Some combinations of these forecasts have driven the 10-year Treasury yield declines we’ve witnessed in the second half of the quarter. For example, a recent composite Purchasing Managers Index indicates the Chinese economic recovery from COVID may have stalled a bit, though it is still relatively solid. Recently supply chain disruptions have the potential to stall or delay the nacent economic recovery in the United States. Our expectation is that the U.S. will experience above average economic growth over the next year or so. However, we are cognizant that economic reports over the last two months or so have been a bit softer than expected. Nevertheless, we believe that U.S. economy, as well as the global economy as a whole, will remain solid., In addition, quirks in the offical CPI inflation tends to reflect housing relating costs with a five quarter lag. Therefore, the inflation rate may be stubbornly above the Fed’s forecast, which logic suggests will lead to higher interest rates.
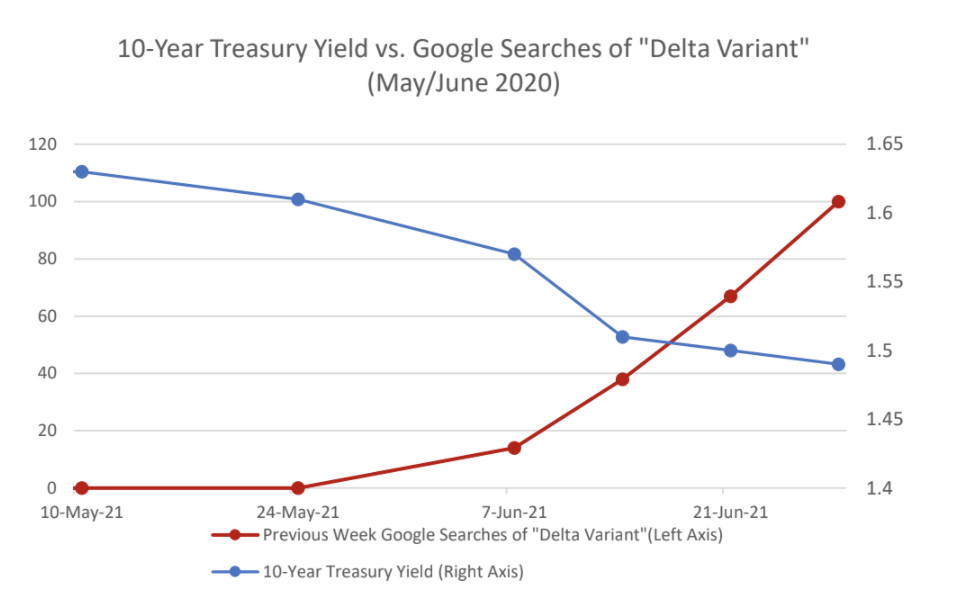
One notable potential influence on recent 10-year Treasury yield is potential renewed concerns about COVID, or at least the new “delta” variant that has been rapidly increasing in prevalence. It is difficult to get reliable, granular data on the spread of the delta variant at this early stage, but one avenue by which we can observe interest in a subject is through the number of Google searches a term generates through time. In collecting that data for the term “delta variant,” we find that interest has spiked from nothing to a great deal of interest in the final weeks of last quarter. At the same time, the 10-year Treasury rate declined.
One interpretation of this interaction is that market participants may be concerned that the delta variant may have the capacity to negatively affect economic activity moving forward, despite current levels of vaccination in the developed world. CNBC recently published a story focusing on their analysis of six countries with both high vaccination rates and elevated COVID infections. Chinese vaccines, provided by Sinovac and Sinopharm, are heavily used in five of the six countries highlighted in CNBC’s analysis. The UK is the sixth country, which uses vaccines by Moderna, AstraZeneca-Oxford, Pfizer-BioNTech, and Janssen. As such, we believe investors have been increasingly worried about the continued efficacy of the current slate of vaccines against variants of the COVID virus. The good news is that serious hospitalization rates and deaths have not risen appreciably.
10-Year Treasury Yield vs. Google Searches of “Delta Variant”
(May/June 2020)
- Left axis: Previous Week Google Searches of Delta Variant
- Right axis: 10-Year Treasury Yield
- Bottom: Month and year
Concern about reduced economic activity is naturally associated with a reduced willingness to invest in value stocks in economic sectors such as banking and manufacturing, as such companies would be likely be negatively affected by any slowing of the current economic re opening. Conversely, it bolsters returns to growth stocks such as Amazon and Google that outperformed during the COVID lockdowns. These are marginal effects, and may be reversed if concern over the delta variant proves short-lived – and may not be short lived if the delta variant, or some further COVID mutations prove disruptive to the economic recovery.
Asset Allocation
The financial markets are considered forward looking “weighing machines” of economic conditions. However, history shows that markets are not omniscient. Paul Samuelson, a renowned economist, once remarked that “the stock market had predicted nine of the past five recessions”. While a bit hyperbolic, his sarcastic comment highlights the periodic schizophrenic nature of financial assets. As such, we pay close attention to the near-term movements of, and relationships between, various asset classes but do not slavishly bend to the shorter-term oscillations.
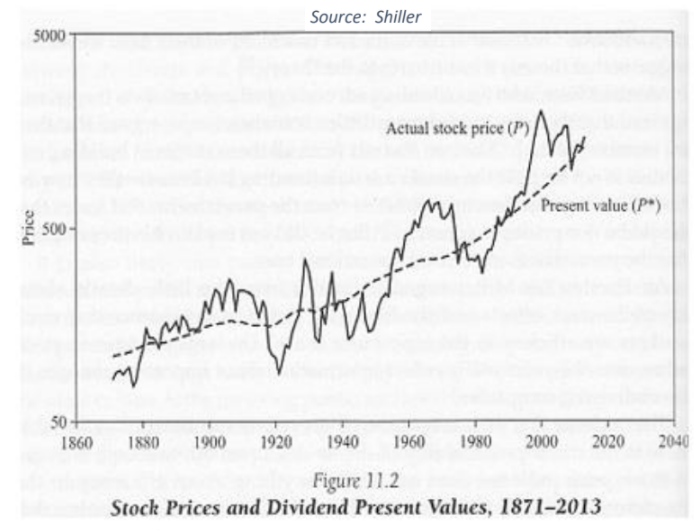
We have previously highlighted the CAPE oriented valuation work of Nobel Prize winner Prof. Robert Shiller. His work has also focused on the role of investor psychology and the resulting impact on market efficiency. The chart to the right is Dr. Shiller’s demonstration of the mathematical valuation of stock prices with the actual realized fundamental inputs and the wide spread of security prices around the “true” value. The important point is that markets are functions of human behavior and humans can go “off their meds” at times.
Stock Prices & Dividend Present Values, 1871 – 2013
- Y-axis: Price
- X-axis: Year
**Source: Shiller**
At this point, we do not find compelling reasons to dramatically change the positioning of client accounts, which remain focused on value-oriented domestic stocks, international equities, shorter duration high-quality fixed income securities, and commodities. However, a continued decline in longer-term government bond yields will likely prove deleterious to the relative performance of such holdings.
Overall, we continue to believe that equities are generally more attractive than bonds. In addition, our view remains that value stocks and international stocks offer more potential than domestic large-cap growth stocks, especially technology related shares. The comparative valuations of value stocks versus growth stocks remain attractive, which is more of a function of how richly priced growth stocks are relative to the rest of the market.
If the bond market’s recent signals presage economic weakness, the small group of mega-cap growth stocks may materially outperform the rest of the stock market similarly as what occurred during the six months following the onset of the COVID epidemic. Given the recent market action, we have contemplated adding exposure to such investments as a hedge. However, a rechecking of our thesis has helped us reaffirm our positioning.
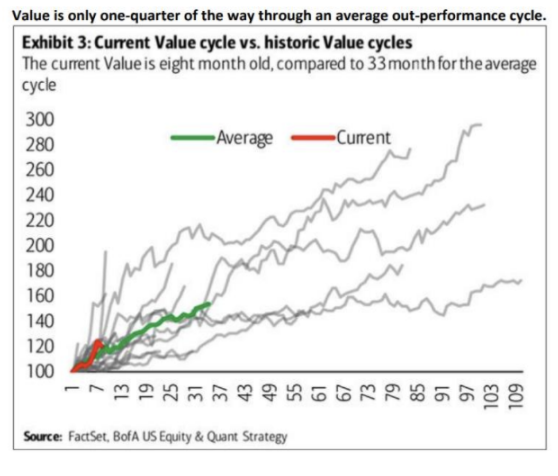
For example, growth stocks enjoyed an unprecedented outperformance cycle from 2009 through late 2020 and remain very expensive, in our opinion. Such cycles tend to be multi year in nature, as shown on the chart to the right. If a new cycle commenced in November 2020 with the Pfizer COVID vaccine announcement, the cycle is still in the early stages.
Current Value Cycle vs. Historic Value Cycles
**Source: FactSet BofA US Equity & Quant Strategy**
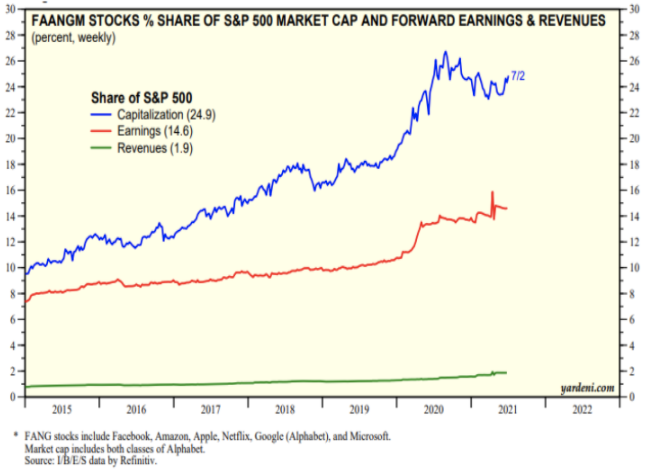
At present, the popular mega-cap tech stocks, which have been popularized by the FAANGM anacronym, account for roughly 25% of the S&P 500’s value but only 14.6% of earnings, and a remarkably small 1.9% of the total sales generated by all constituents of the S&P 500. Our interpretation is the current pricing of these stocks allows for little if any disappointment in the future, which could result from economic and/or regulatory shocks. Studying the past shows that such confidence is rarely profitable.
FAANGM Stocks % Share of S&P 500 Market Cap & Forward Earnings & Revenue
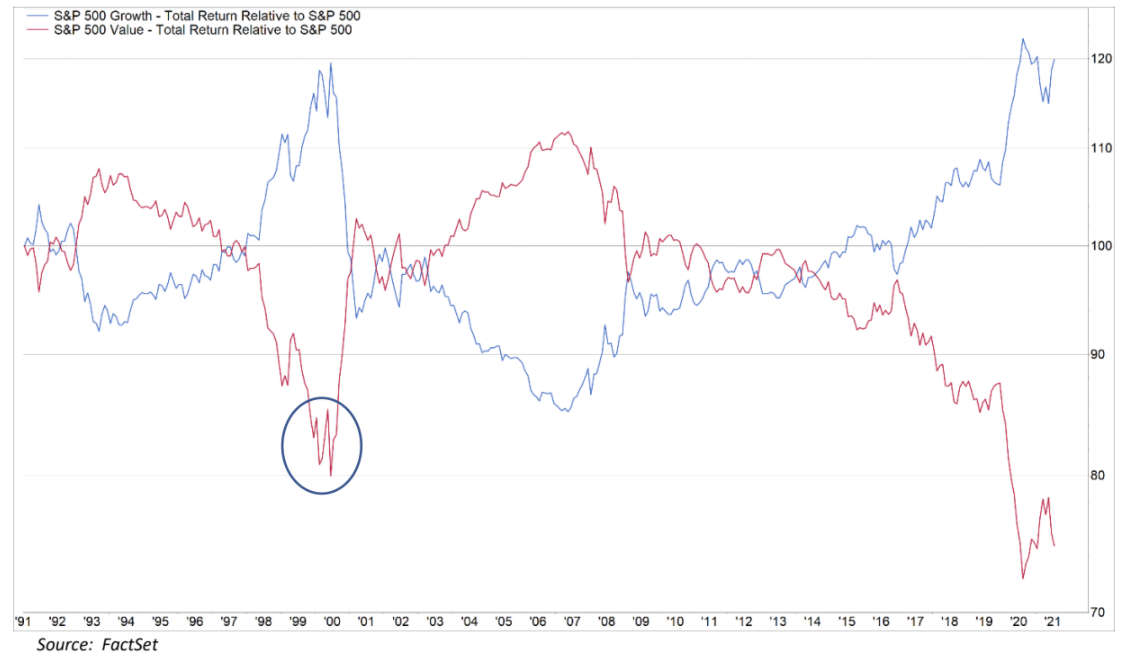
Lastly, the chart above shows the relative performance of domestic large-cap growth stocks versus their value-oriented cousins; the blue/red line represents growth/value stocks and an upwards/downwards trajectory represents outperformance/underperformance. The recent relative setback of value stocks has our attention and raises questions that still need to be answered. However, the chart reinforces the reality that the markets will try to “shake you” from your investments. The circled area of the chart shows a “saw tooth” pattern of value stock relative performance during the peak of the tech bubble. Most investors remember that period as one of obvious gross tech stock overvaluation. The reality is that the change in the stock market leadership was a process and one needed to maintain conviction. That is our stance today.
For those wishing to delve deeper into our rationale for value and international equity exposure, shorter duration high quality fixed income securities, and commodity exposure, please refer to our Q1’2020 client letter. The motivation for undertaking such hedges has clearly not diminished given current market conditions.
Closing Thoughts
The current investment environment presents many challenging questions. Investors are wary of the potential of reduced governmental support for the economy and financial markets, a possible new wave of COVID infections, more aggressive regulatory and tax policies, along with many others. At the same time, the valuation of many asset classes remains rich. We continue to investigate how to best improve our clients’ odds of meeting their long-term goals given today’s realities. As such, we want to emphasize that our goal is to focus on what we can control, which is premised upon long-term financial planning issues such as risk management, realistic goals, and tax planning. As always, we treasure our client relationships and look forward to helping construct and execute the best customized plan to help them accomplish what is meaningful to them.
ASA W. GRAVES VII, CFA®
Partner | President & Chief Investment Officer
JASON FINK, PHD
Director of Research
ASHLEY “ASH” HEATWOLE, CFA®
Associate Director of Wealth Management, Portfolio Manager
DISCLOSURE
Stocks offer long-term growth potential but may fluctuate more and provide less current income than other investments. An investment in the stock market should be made with an understanding of the risks associated with common stocks, including market fluctuations. Stock dividends are not guaranteed. Investments primarily concentrated in one sector may be more volatile than those that diversify across many industry sectors and companies. The technology industry can be significantly affected by obsolescence, short product cycles, falling prices and profits, and competition from new market participants. Global/International investing involves risks not typically associated with U.S. investing, including currency fluctuations, political instability, uncertain economic conditions, different accounting standards, and other risks not associated with domestic investments. Investments in emerging markets may be subject to additional volatility. Stocks of small and mid-cap companies may also be subject to greater risk than that of larger companies because they may lack the management expertise, financial resources, product diversification and competitive strengths to endure adverse economic conditions. The value of fixed income securities will fluctuate with changes in interest rates, prepayment payment rates, exercise of call provisions, changes in the issuer’s credit ratings, market conditions, and other variables such that they may be worth more or less than original cost if sold prior to maturity. There is also a risk that the issuer will be unable to make principal and/or interest payments. Although treasuries are considered free from credit risk they are subject to other types or risks. These risks include interest rate risk, which may cause the underlying value of the bond to fluctuate, and deflation risk, which may cause the principal to decline and treasury securities to underperform traditional securities. The material has been prepared or is distributed solely for information purposes and is not a solicitation or an offer to buy any security or instrument or to participate in any trading strategy. Past performance is not indicative of future results and there is no assurance that any forecasts/targets mentioned in this report will be attained. The indices have been provided for information/comparison purposes only. Individual investors cannot directly invest in an index.
