Fourth Quarter Newsletter – 2020
Main Points:
- The financial markets enjoyed strong Q3’2020 returns as the global economy experienced a remarkable rebound. The continuing momentum of the economic recovery will be directly affected by the status of COVID outbreaks and medical efforts to control the spread and medical impact.
- The current election cycle is a focus of many investors. Historically, stocks have experienced very similar performance regardless of the political parties in power. We believe it is foolhardy to try to adjust your stock holdings based upon political affiliations and worries. This election cycle has unique circumstances, but the market has factored in increased price risk around the Election, which could be supportive to stock prices if events are less disruptive than feared.
- We believe the expectations currently built into the prices of growth stocks assume an overly optimistic view of future earnings. We are mindful of Warren Buffett’s warning that, “For the investor, a too-high purchase price for the stock of an excellent company can undo the effects of a subsequent decade of favorable business developments”.
- In our first newsletter of the year, we made a case for adding commodity exposure to portfolios given the asset prices prevalent at that time. In our opinion, current conditions provide an even stronger case. Our preferred investment option is a low-cost mutual fund mimicking the broadbased Bloomberg Commodity Index, which is analogous to using an index fund to replicate the S&P 500 for equity investing. To be clear, we are not suggesting our clients become involved in active commodity trading.
- We encourage our clients to work with us to help coordinate their legal documents, tax strategies, and risk positioning. Now is a particularly good time to undergo such reviews given high asset prices and a potential change in tax policy. Please let us know how we can help.
“The most important quality for an investor is temperament, not intellect. You need a temperament that neither derives great pleasure from being with the crowd or
against the crowd.”
-Warren Buffett
Overview
Markets continued their strong recoveries during the third quarter ended September 2020. In fact, the S&P 500 made a new all-time high on September 2nd before correcting during the remainder of the quarter. Even so, the S&P 500 rose 8.9% during the quarter with attractive returns across most of the equity universe. Once again, large-capitalization domestic growth stocks experienced stronger returns with the S&P 500 Growth index increasing 11.8%. In comparison, the S&P 500 Value index rose 4.8% with mid-cap, small-cap, and developed international stocks all increasing in a similar 4.8%-4.9% range. Fixed income achieved modest returns with the Bloomberg Barclays U.S. Aggregate Bond index up 0.6% while commodities continued to recover with the Bloomberg Commodity Total Return index jumping 9.1%.
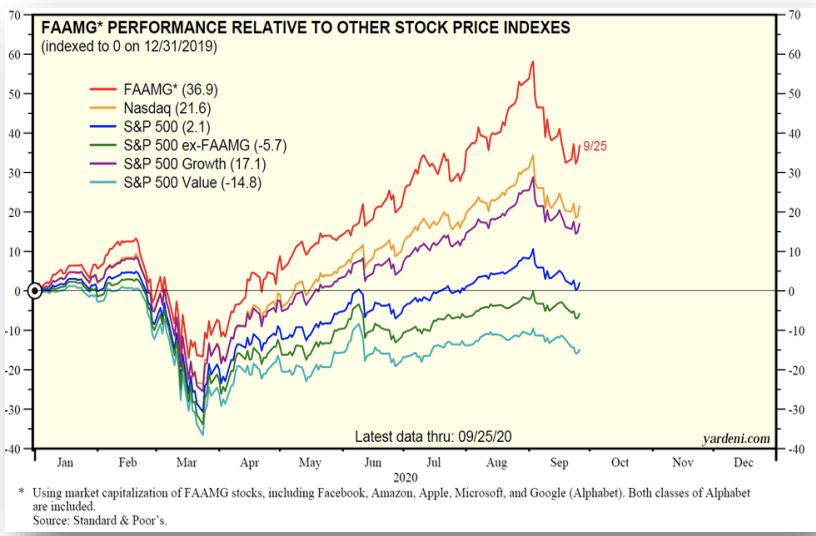
As detailed in previous reports, the S&P 500 continues to be driven by the five largest stocks, commonly referenced by the acronym FAAMG (i.e.Facebook, Amazon, Apple, Microsoft, and Google(Alphabet)). The accompanying chart shows the outsized impact these stocks have exerted on the S&P 500. Specifically, the S&P 500 was up 2.1% for the year through September 25th, when this chart was created by Ed Yardeni and his team, but the performance dropped to a year-to-date loss of -5.7% excluding the FAAMG stocks. Later in
this letter, we address what we believe to be the risks of such outsized performance from 1% of the total companies within the S&P 500. Nonetheless, large growth stocks, especially those of a technology persuasion, have continued to generate impressive performance.
Economic Trends and Concerns
The state of the real economy has fluctuated substantially this year, but the recovery during the third quarter was impressive. The initial incursion of the pandemic caused first quarter real GDP to drop by an annualized -5%, which was the worst one quarter drop since the beginning of the financial crisis in 2008. This was followed by a 2nd quarter real GDP drop of an unprecedented -31.4%. The first official estimates of third quarter GDP growth do not come out until Oct 29, but all preliminary indications are that the economy has been recovering faster than expected from the pandemic-induced recession. Evercore ISI, an economic forecasting group we follow closely, forecasts real GDP growth of -0.9% for the entirety of the year, which they expect to be a consequence of a historically strong snap-back of +35% or so during the recently completed quarter (Q3’2020). This latter figure is in line with the GDPNow estimate of Q3’20 put out by the Atlanta Fed. It is important to note that these rebound percentages, because they are increases from a lower level of GDP, do not necessarily imply higher GDP than the beginning of the crisis. Indeed, it still takes a forecast of +10% for the fourth quarter to reach the forecasted -0.9% annual loss. As you can imagine, the continuing momentum of economic recovery will be dependent upon the prevalence of the coronavirus in the country. GDP growth will proceed more slowly if a greater than expected surge in the virus takes place as the weather turns colder and people therefore curtail their economic activity.
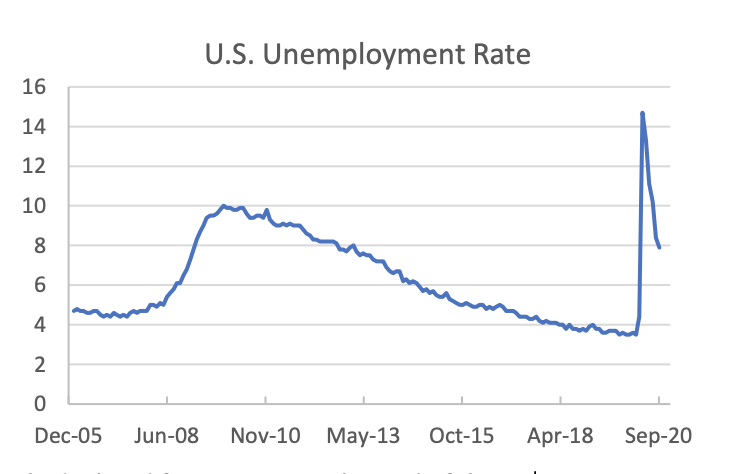
The labor market is similarly rebounding, though the recovery in the labor market does not appear to be nearly as strong as the GDP figures suggest. Total nonfarm payrolls added 661,000 jobs in September, bringing the unemployment rate down to 7.9% from its peak in April of 14.7%. However, economists had expected 859,000 new jobs, and the decrease in the unemployment rate was, to some extent, attributable to laid-off individuals no longer looking for work. The labor force participation rate has modestly declined from 61.5% at the end of the 2nd quarter to 61.4% at the end of September. Both of these numbers are down significantly from the start of the year, when this rate was 63.2%.
The unemployment rate is expected to continue to drop as the economy recovers. However, only the Great Financial Crisis and the recession of the early 1980s have provided unemployment rates higher than 7.9% in the last 40 years. As temporary layoffs from the spring turn into permanent layoffs, recovery in the labor market is forecast to be steady but slow. Evercore ISI forecast the unemployment rate at the end of 2021 to be 6.0%, which is near the levels of unemployment at the height of the tech bust and the early-1970s oil embargo.
In our previous report, we stated “that it is important to remember what the stock market is, and what it is not. It is not a gauge for the well-being of U.S. citizens.” We emphasized this point as many have had difficulty reconciling the stock market’s strong rebound during a period of shocking unemployment and economic difficulties caused by the terrible devastation of the COVID-19 virus. Small businesses, which tend to be more focused on direct customer interaction and have less financial cushion, have suffered disproportionally relative to larger companies with publicly traded stocks. As such, the stock market is dispassionately reflecting the relatively stronger current position of larger companies as well as the potential for future market share gains as many small businesses disappear. One does not have to like this signal, but markets are cold and calculating machines. Larger companies are likely to enjoy even stronger market positions the longer it takes to develop and distribute a reliable vaccine.
The massive amount of governmental stimulus is having an impact on the securities markets as interest rates have been reduced to historically low levels. This has resulted in an enormous increase in money supply, which can affect asset prices. However, it is difficult to ascertain the degree that asset prices have been increased from the amount of stimulus alone. Further stimulus could be on the way in the form of a new economic theory known as Modern Monetary Theory (MMT), which is based on the premise that a country in control of its currency can operate with high budget deficits financed by heavy debt issuance. In short, the theory is based upon the idea that a country issuing debt in its own currency can never run out of the money necessary to service the debt. According to MMT adherents, government spending can increase up to the limits of full employment which will be signaled by an increase in inflation. At that point, spending could be decreased and/or taxes increased to slow the economy and create enough slack to reduce inflationary pressures.
Even if one believes the government will be responsive to inflationary trends and make the tough political choices to reduce spending and/or raise taxes, MMT is based upon continued demand for the currency in question. For decades, the United States dollar has enjoyed an “exorbitant privilege” as the international reserve currency, which allows for the importation of goods and services along with debt issuance, in dollar terms. If the U.S. dollar’s reserve status weakens, foreign goods could cost more, and debt issuance may become increasingly difficult. Loss of such reserve status would harm the economy deeply. We are not MMT adherents, but rather are trying to gauge the likelihood that such policies could be implemented and the likely subsequent impact to financial assets
We remain humble given the number of unknowns. We continue to spend significant time and resources researching historical data and relationships to help develop an improved investment posture. Nonetheless, the confluence of the evolution of the virus, the election season, horrifying fires, and a seemingly never-ending list of calamities and misfortunes have made the current environment very difficult. We are not ashamed to admit it and shake our heads at those offering confident, if not brash, projections with accompanying recommendations promoting risky portfolio positioning.
The Election
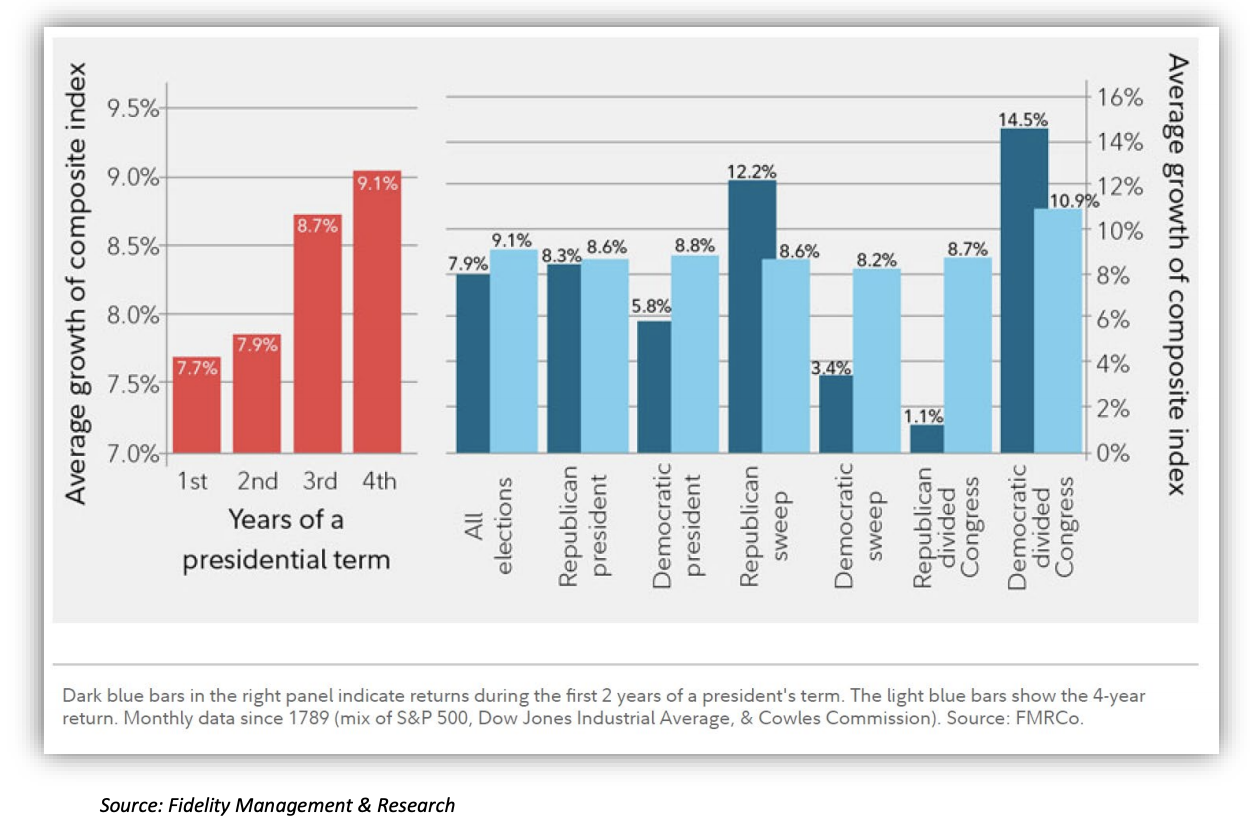
The current election cycle is compounding investor angst. With nerves already frayed, many market participants are worried, if not upset, about the real and perceived threats posed by politicians of the opposing party. Dire forecasts of impending economic doom caused by which political party will control government are argued, if not screamed, by partisan “reporters” and “personalities” in the popular media. Our own views regarding taxation and regulatory policy are not important. What is important is that stocks have historically done well regardless of which party controls the Federal government. Media sources often state that the stock market has performed better under a Democratic Presidents. However, the complete historical record from the founding of the United States shows a virtual tie with an average 8.8% annual return for Democratic Presidents versus 8.6% under Republican Administrations as shown in the chart below; the entire term is reflected by the light blue columns and the 9.1% return for all elections includes Presidents from other parties during the United States’ formative years.
A more complete picture should include the makeup of Congress, which controls the nation’s purse and passes legislation. Of note, the stock market has behaved very similarly under the various combinations of political control (i.e. control of the Presidency and both houses of Congress and various combinations of control of these power centers); the noticeably superior results of Democratic Administrations with a divided congress occurred with only a few times and were heavily influenced by President Clinton’s and President Obama’s second terms.
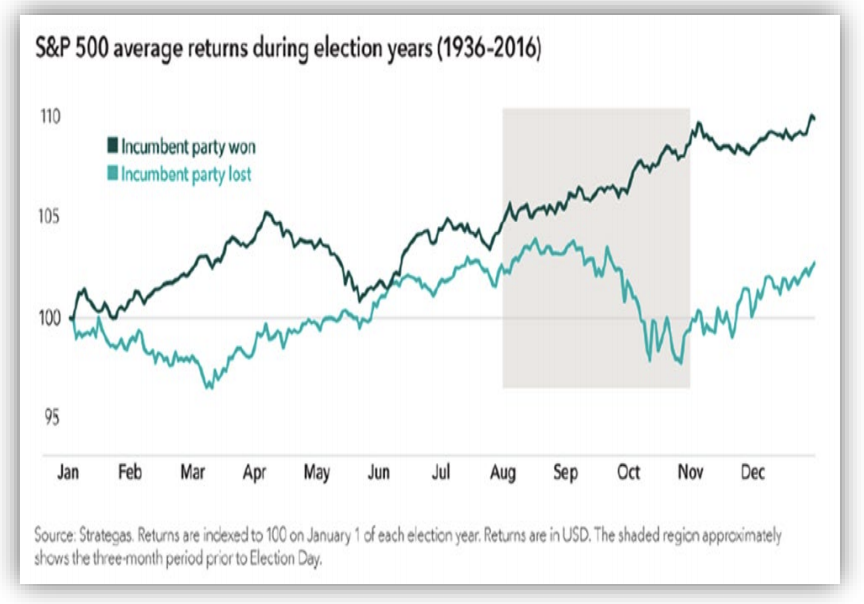
Our main message is that the party makeup of political control has not had meaningful long-term impacts on stock market returns. We believe it is foolhardy to try to adjust your stock holdings based upon political affiliations and worries. On average, the stock market has experienced mild losses in the month or so leading into Election Day when the incumbent President has lost, while the stock market has typically gained through the Election when the incumbent President wins.
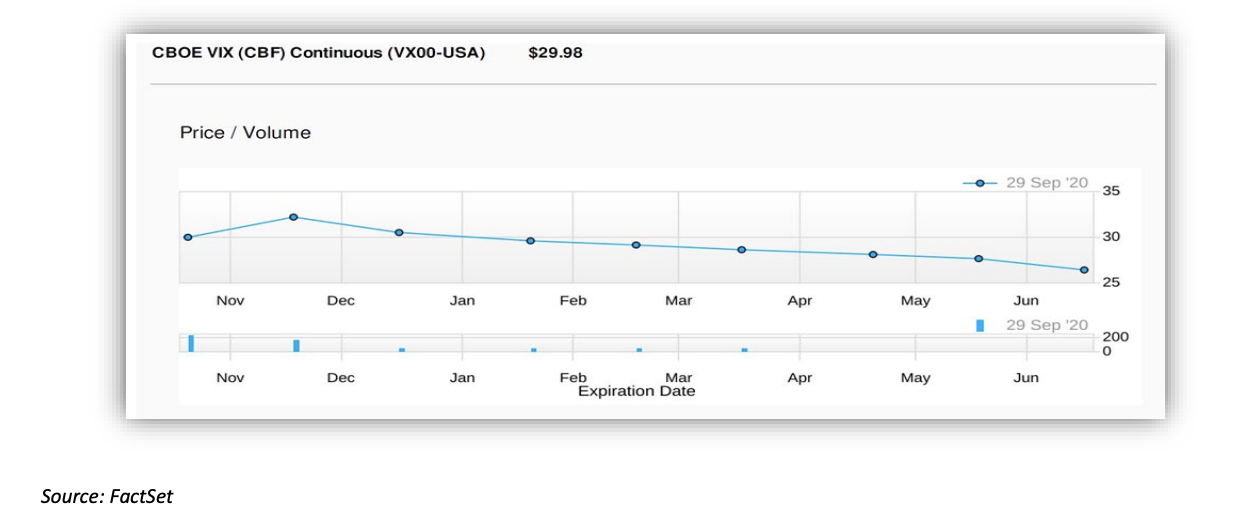
Yet, we appreciate the unique circumstances of this election. Large scale mail-in ballots and virus-related issues could create a delay in the timely election resolution Americans are used to. One can dream up many troubling scenarios. Nonetheless, stock market participants have built in a degree of margin around the election already, which may help to truncate potential downside risk. As shown in the following graph, the market for the VIX index has a decided peak (i.e. increased risk) around the Election. The VIX is a measure of expected volatility of the S&P 500 with higher levels denoting increased projected stock price swings. The take-away is that the market appears to have factored in increased price risk around the Election, which could be supportive of stock prices if events are less disruptive than feared.
Equity Market Positioning
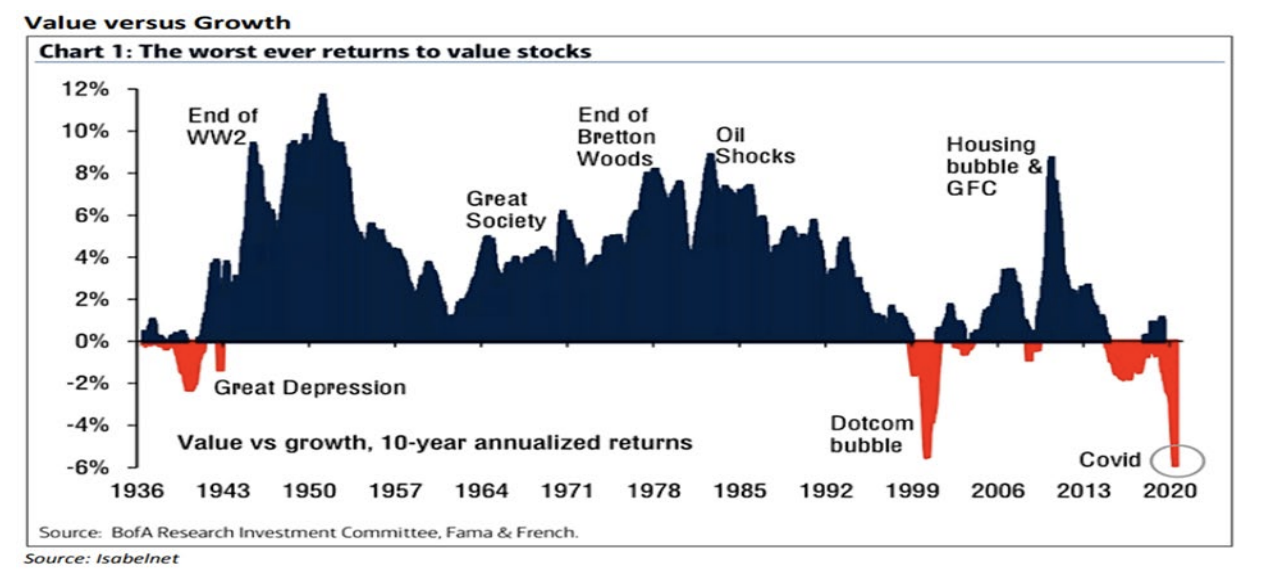
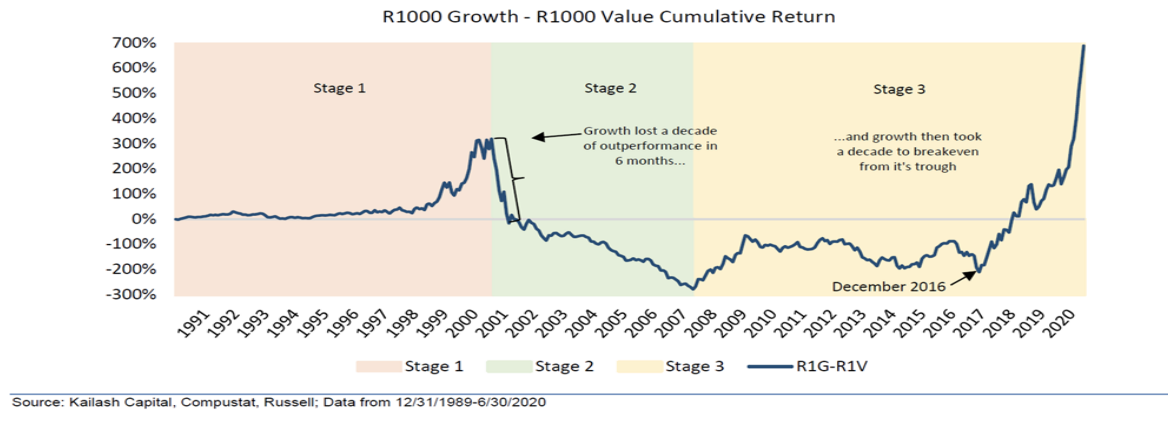
Growth stocks have continued to power ahead of the rest of the stock market. As we have noted previously, growth stocks are more expensive relative to their value-oriented brethren than during the dot.com bubble and have now enjoyed their largest outperformance on record. Our research shows that value stocks could experience superior performance as the economy continues to recover, with the potential to recover much, if not all, of the ground lost to growth stocks over the current cycle of 10 years or so.
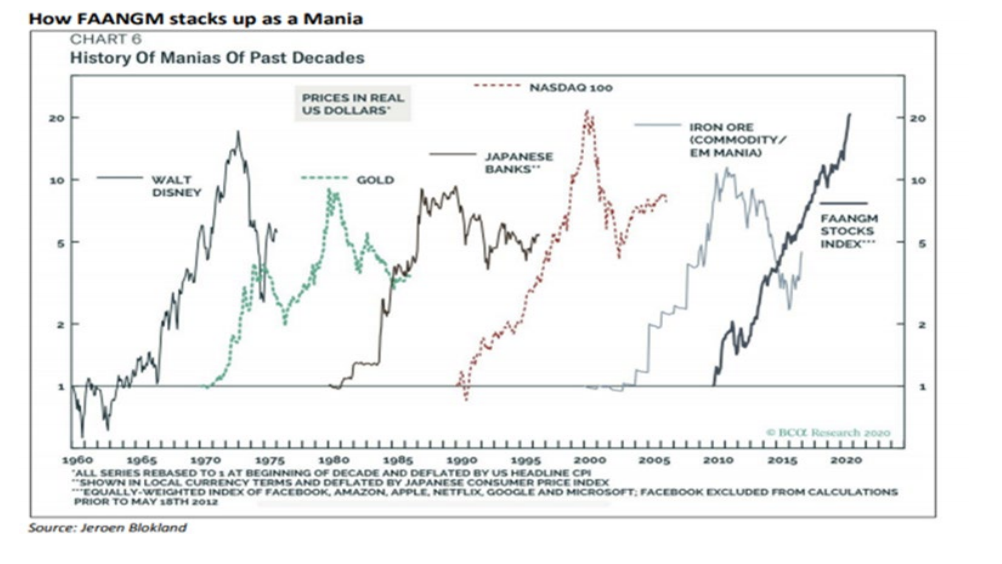
Of particular concern is the size and valuation of the large technology-oriented stocks, namely the so-called FAANGM stocks (i.e. Facebook, Amazon, Apple, Netflix, Google, and Microsoft). These stocks have achieved fantastic returns with the COVID-19 related spurt driving the aggregate return to challenge the best performing areas of the market during past decades.
There are no rules that neatly indicate when important internal stock market shifts will occur. However, we are mindful, maybe too much so, of Warren Buffet’s warning that, “For the investor, a too-high purchase price for the stock of an excellent company can undo the effects of a subsequent decade of favorable business developments.” Stock prices are a function of expected future cash flows. If such expectations are not met, future stock price performance typically disappoints.
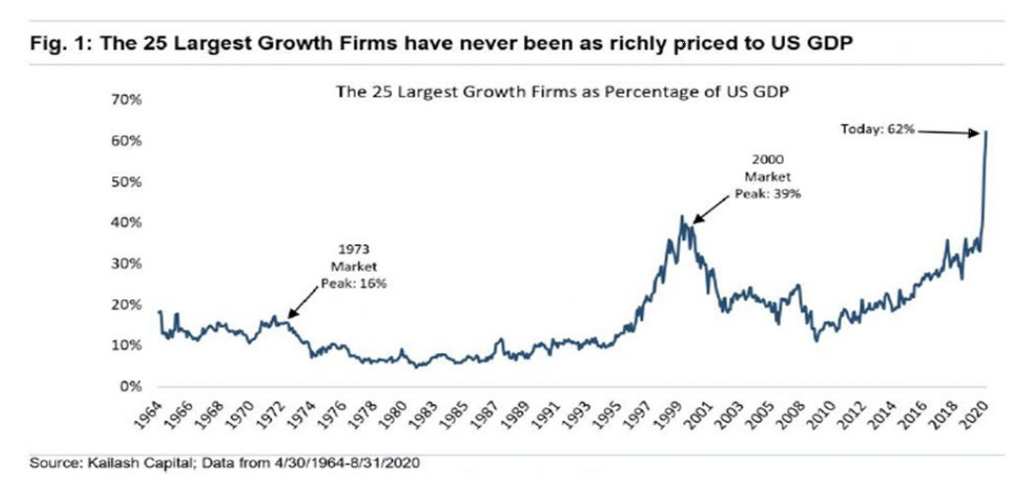
We believe the expectations currently built into the prices of growth stocks assume an overly optimistic view of the prospects for these firms. Growth stocks look expensive on traditional valuation metrics, such as Price/Earnings, Price/Cash Flow, etc. However, sometimes it is helpful to step back and look at things with a larger perspective, which can provide more revealing insights. For example, the aggregate market capitalization of the largest 25 growth stocks currently represents the largest percentage of U.S. GDP for at least the past 55 years of so, and by some margin.
We do not know when a sustained change in the growth vs. value stock dynamic will change but we are confident that the relative fortunes of growth and value stocks will revert towards historical norms. The natural tendency is to try to ride the current trend as long as possible. However, it is incredibly difficult to make a successful transition from such stocks once the change in market internals occurs. For example, the sublime relative outperformance of growth stocks over the prior decade into the peak of the dot.com bubble in March 2000 was erased in approximately six months.
International stocks appear to be better priced for attractive long-term returns (i.e. 5 years +) relative to their U.S. large-cap counterparts. For example, international stocks are currently trading a CAPE multiple of approximately 16X , which is well below the S&P 500’s 30X CAPE multiple; later in this paper we argue that the current U.S. CAPE reading strongly suggests that U.S. large-cap stock returns will be well below their historical average over the next 10 years or so. Importantly, international stock indices have less exposure to technology stocks and are more exposed to materials, industrials, and financial companies, which have struggled relative to the “sexy” and “disruptive” domestically based tech stock darlings.
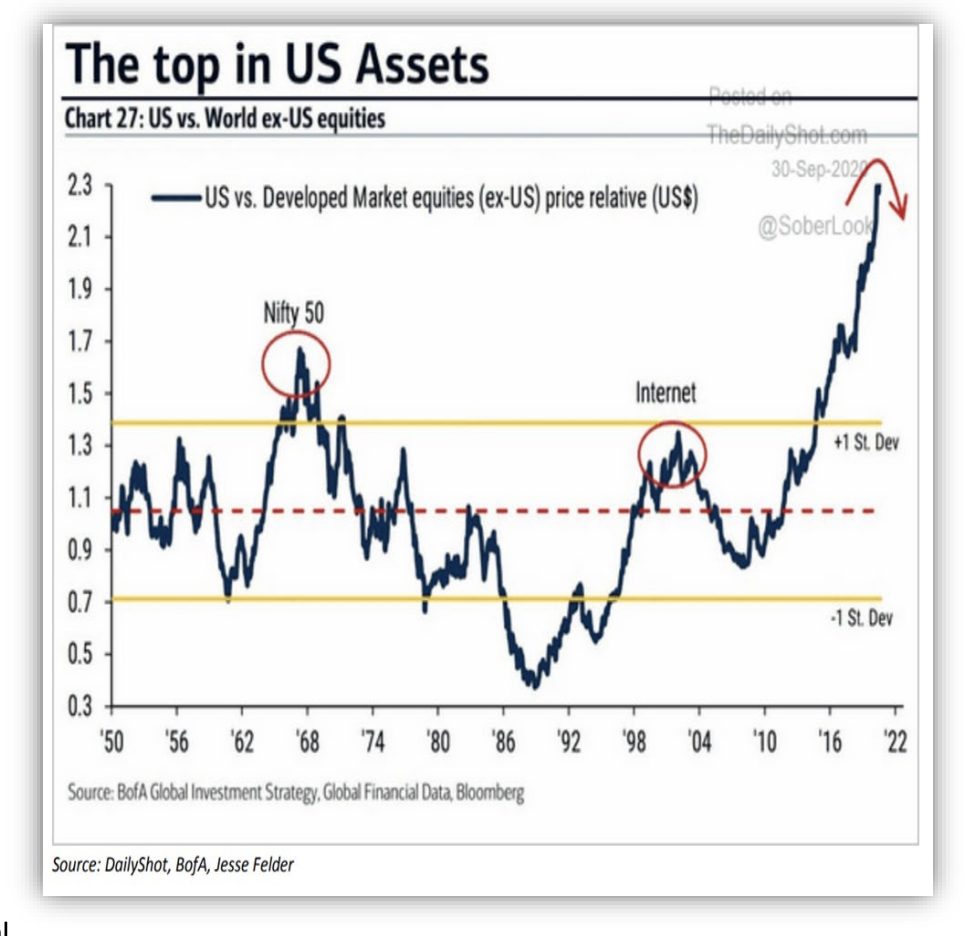
In our opinion, international stocks deserve an increasing weighting within equity portfolios targeted to long-term goals. As depicted in the chart to the right, U.S. stocks are historically extended versus stocks domiciled outside of our borders. International stocks tend to outperform during periods when the U.S. dollar underperforms against foreign currencies (i.e. U.S. investor gets “paid” more in dollars for each unit of earnings of foreign companies). We believe that international stocks are positioned to offer superior risk adjusted returns for the foreseeable future (i.e. the cumulative returns over the next 5 years+) but it is impossible to identify the exact turning point.
Asset Allocation Considerations and Recommendations
In our first newsletter of the year, we discussed at length the importance of asset valuation in the consideration of how to allocate assets. We have been through quite a bit this year (our nod to British understatement), and yet from a valuation standpoint, markets ended the third quarter in a situation rather similar to the beginning of the first. Unfortunately, if anything, the environment for long-term investment allocation has grown a bit more challenging. Earnings have declined (though they are recovering faster than any of us had hoped back in April), but stock prices are generally higher than they were in January. Interest rates are lower than they were at the start of the year, which is good news for the economy but reduces the expected returns on bonds moving forward.
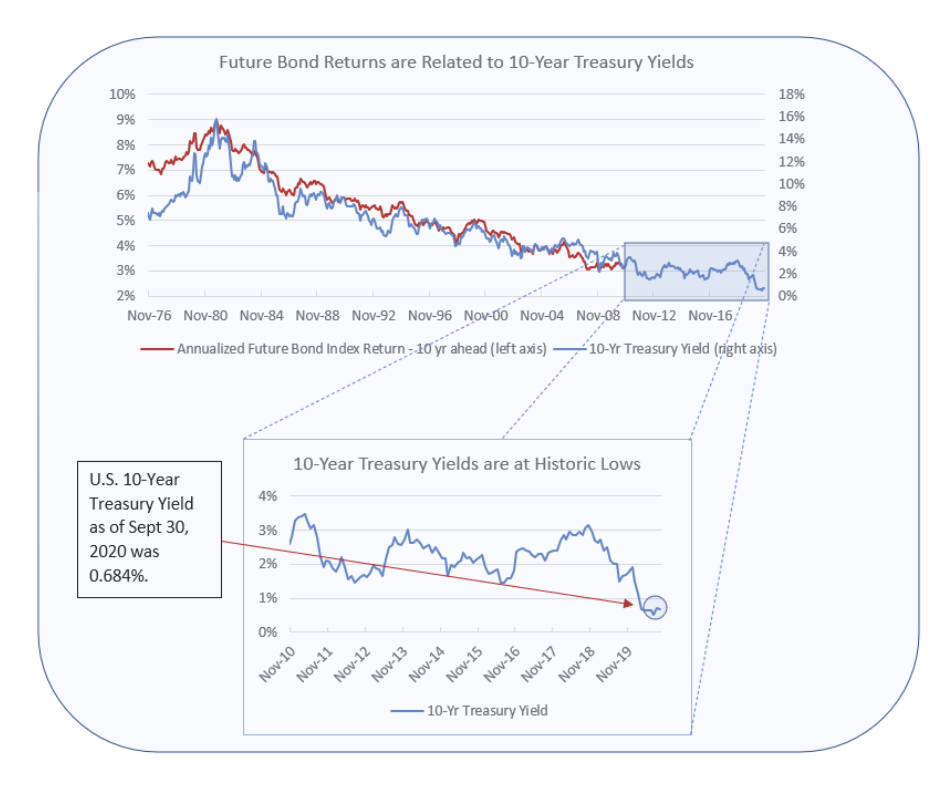
To see how these valuations affect asset returns, let’s first consider the current state of the bond market. Historically, future bond index returns have been strongly related to current US 10-year Treasury bond yields. When 10-year Treasury yields are low, the bond market tends to provide lower returns over the next ten years. We have discussed this in the past, and the close relationship can be seen in the top panel of the figure above. For the years represented in the area of the blown-up portion of the graph, we do not have 10 years’ worth of data yet, and so we do not know what the 10-year forward returns will be. However, we can see how the 10-year Treasury yield has behaved. At the close of the 3rd quarter following substantial Fed intervention, its yield was at a historic low of 0.684%. By comparison, at the end of 2019 this value was about 1.92%. Looking forward, we expect bonds to return well below their historical averages, with a 10-year forward looking prognosis that is even worse than the beginning of the year.
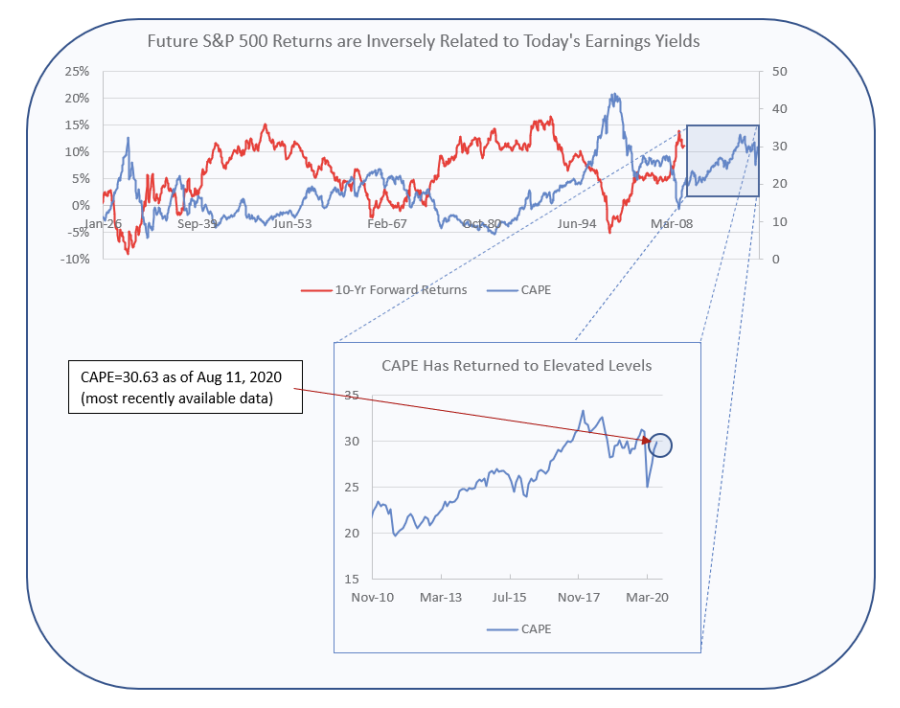
The environment is similarly challenging for equities, though our preferred method to determine valuation is more complicated. To assess this, we use a measure known as a “cyclically-adjusted P/E ratio,” or CAPE. P/E ratios are used by analysts as a gauge of how the stock market is valued. For example, consider a company with a stock price of $100 and earnings last year of $5. The P/E ratio of this company would be 20, meaning that investors are currently willing to pay $20 for each dollar of earnings from the company. CAPE stabilizes this ratio by using a backward-looking 10 year moving average of earnings. The market-wide CAPE, put forth by Nobel Prize winner Robert Shiller, has been demonstrated to be negatively associated with future market returns at a 10-year horizon. The figure to the right illustrates this inverse relationship – when CAPE is high, future returns tend to be low. When CAPE is low, the converse tends to be true (i.e. when the blue line is high, future returns—denoted by the red line–tend to be low and vice-versa).
At the beginning of 2020, we were concerned about the implications of the elevated level of CAPE. The pandemic and anticipation of its associated economic effects abruptly dropped asset prices and CAPE in March of this year. As can be seen in the blown-out portion of the figure, that recent dip in CAPE has increased to close to a level very similar to the beginning of the year. According to Robert Shiller’s website, CAPE was at a value of 30.65 at the end of 2019, and was 30.63 as of Aug 11, the most recent date for which the data is available (this is a slow-moving variable and hasn’t changed much since that time). This return to elevated valuation levels lowers the long-term expected returns to the market well below their historical averages.
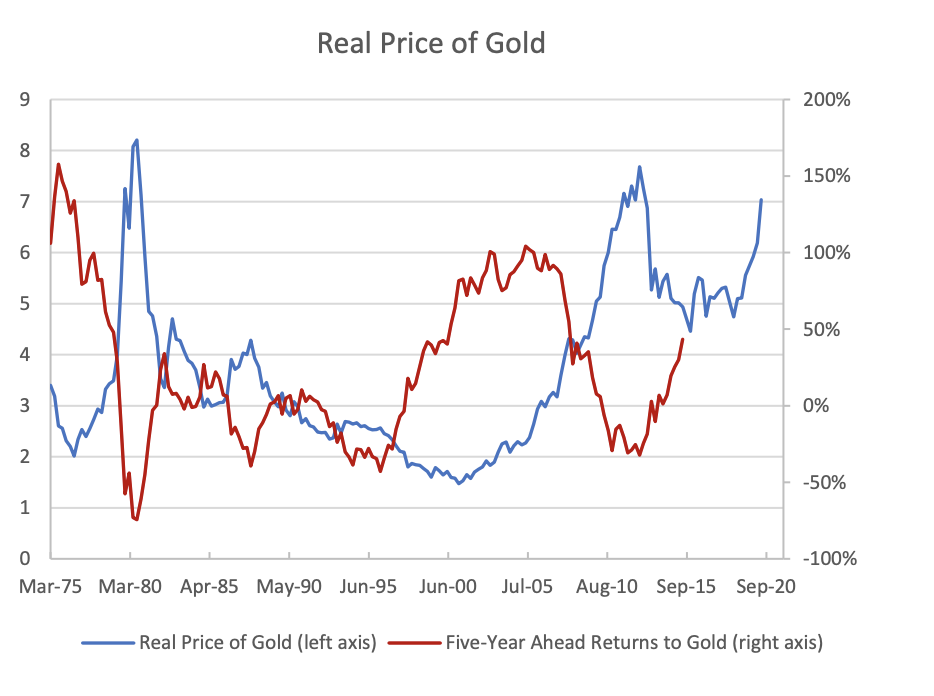
Which brings us to gold. PE ratios, of course, do not exist for gold. The “E” part of that ratio is earnings, and gold does not earn anything. But the concept of valuation, and the possibility that it might become stretched, applies as much to gold as to any asset. Accordingly, recent research proposes a similar metric that might forecast gold returns: the real price of gold. This is just the price of gold, adjusted for inflation.
Crucially, just as in the PE ratio, the “real price” of gold is a ratio in which the price is in the numerator. The logic of the CAPE is that when people are overconfident in an asset, they are willing to pay more for it, and thus bid up the price. If the ratio of a given asset is stable in the long run, it must eventually return to its mean, and most of this adjustment takes place through a reduction of the price. The real price of gold appears to have similar stability and we expect such a revision to occur unless major market fundamentals experience significant changes.
As of Sept 30, 2020, the nominal price of gold was $1,887.50, while the most recent measurement for Urban CPI was 259.681 (seasonally adjusted), leaving a real price of approximately 7.27. It can be seen in the chart to the right that this is a particularly expensive real price for gold. Needless to say, past performance is no guarantee of future results. But unless “this time is different,” it is a particularly risky time to consider investing in gold unless inflation picks up dramatically. If one is worried about protecting future purchasing power in the face of potential inflationary effects resulting from unprecedented government deficits and the resulting debt issuance, gold holdings may still offer utility. However, if an inflationary spike does not occur, the price of gold may fall precipitously given its current valuation. For example, in March of 2013, the last time gold was similarly expensive, the five-year ahead return to investing in gold was approximately -18%. In the early 1980s when gold was at its peak cost in real terms (at a level of about 8.20), the five-year return to holding was an abysmal -75%.
In our Q1’2020 client report, we introduced our recommendation to add broad-based commodity exposure into the asset allocation decision making process, both for overall price diversification and inflation protection. Research from AQR, a large investment manager, showed bonds and commodities had low correlation (i.e. do not move together) to stocks over the 1926-2017 period. Therefore, we believe commodities should be best thought of as diversifying assets (not influenced by stock price movements) which help improve the risk/return profile of portfolios and could be particularly valuable during periods of increasing inflation. Commodities span a large and disparate set of assets, which tend to increase in value during periods of inflation, but imperfectly so. By contrast, Treasury Inflation Protected Securities (TIPS) are a more direct and reliable hedge against inflation, if inflation hedging is of particular concern.
Our preferred investment option for commodity exposure is a low-cost mutual fund with broad commodity exposure as represented by the Bloomberg Commodity Index. As such, we are investing in the commodity space in a similar manner as stock investors purchasing an S&P 500 index fund and not utilizing active commodity trading. Please refer to our Q1’2020 Client Newsletter for more detail, which we are happy to send upon request.
Closing Thoughts
Financial assets continue to display impressive resilience with many near their all-time highs. Nonetheless, now is the time to examine the entirety of your wealth plan, including the appropriate risk tolerance for investment portfolios and tax strategies. Furthermore, it is an excellent time to make sure legal documents are in order and in concert with personalized long-term goals. We do not know the outcome of the upcoming election, but the resulting political makeup could lead to meaningful changes to how your assets will be taxed in the future. Graves Light Lenhart’s capabilities are constantly expanding to help you plan for such outcomes. Let us know what we can help you live your best life in concert with your
dreams and values.
Best regards,
Asa W. Graves VII,
Chief Investment Officer
CFA Jason Fink, PhD
Director of Research
